In this article, one of the blog contributors, Mile, will look into a simple approach, which is based on sensitivity coefficients and dynamic P-V curves, in order to define the optimal location of SVC FACTS device. The used method actually consists of identifying the weakest buses in the system through the P–V curves. Enjoy!
SVC stands for Static VAr compensator and is the mostly used device of the FACTS. Its main function is to provide voltage regulation at a specifically chosen bus, simply by controlling the reactive power injection at the defined location. Rapid response is its main characteristic.
We have tested and verified the scenario in normal and abnormal condition on the IEEE 14 bus system with FACTS devices. The method has been applied on the 220/400 kV transmission network of the Albanian Power System, in order to determine its characteristics.
Power system model for analysis
SVC configuration is presented with a fixed capacitor (FC) and Thyristor-Controlled Reactor (TCR) as presented on picture 1. The thyristors in the circuit are fired symmetrically, in an angle control range starting from 90 to 180 degrees, with respect to the capacitor (inductor) voltage.
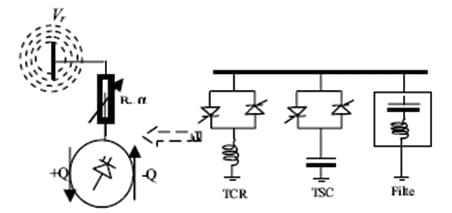
Picture 1. SVC circuit representation
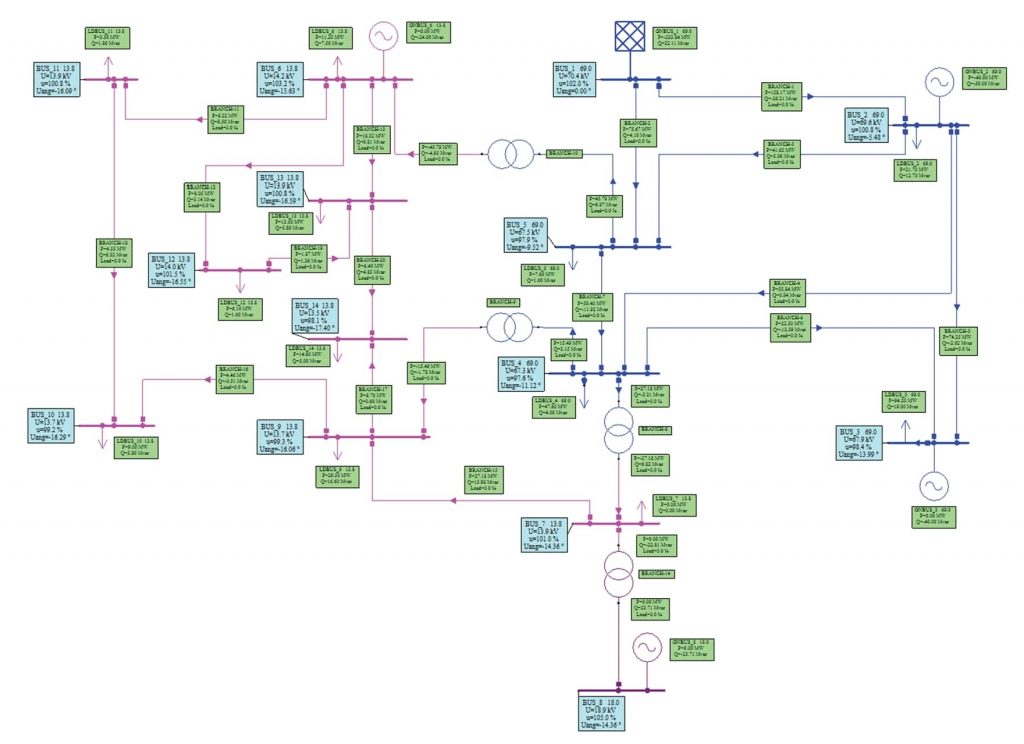
The system studied in this article is the 14-bus IEEE test system, presented on picture 2.
Defining optimal location and simulation results
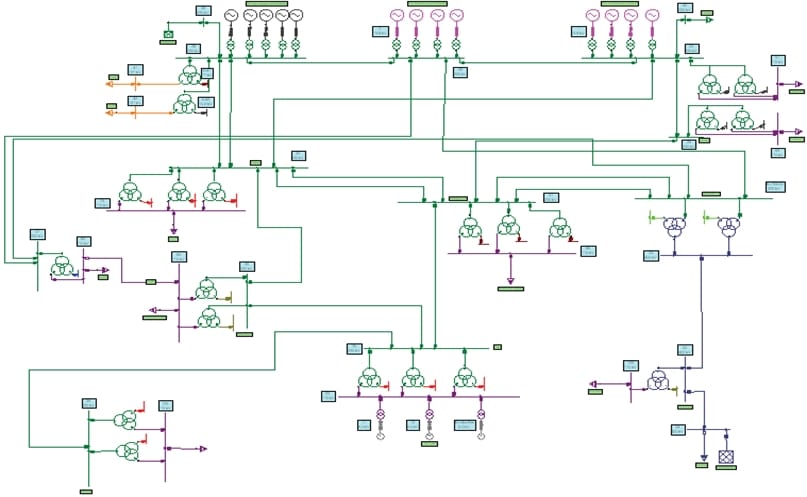
The test scenario is tested in the case of the 14 bus IEEE system and further it is applied in Albanian Power System, presented on picture 3.
The P-V curves for all buses are presented on picture 4, while assuming there is a uniform increase of the load on all buses. The weakest bus can be easily identified. It is the bus that has the lowest bus voltage for a given system load. From picture 4 we can see that bus 4 is the weakest bus, because of its low characteristic. This will be the first location where we are going to place SVC.
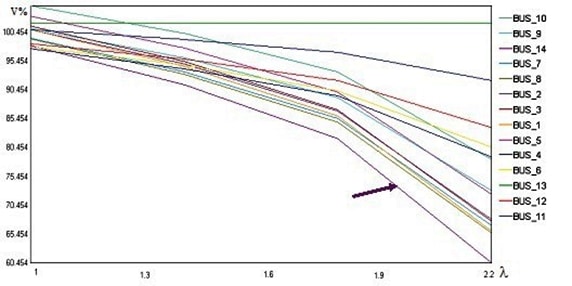
Picture 4. Voltage profiles of the buses without FACTS installed
After installing the SVC with the defined parameters at bus 14, the minimal value of the voltage increases from 0.6 Vn to 0.8 Vn, unlike the maximum value, which remains unchanged. Picture 5 shows the impact of SVC installation at all buses in the system.
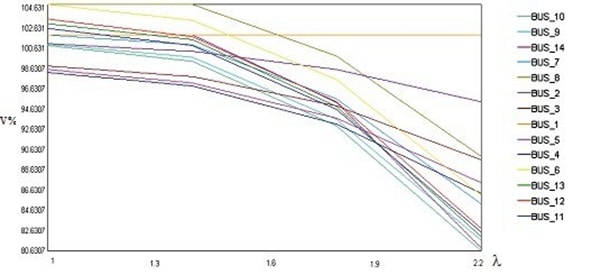
Picture 5. Voltage profiles of the buses with SVC at BUS 14
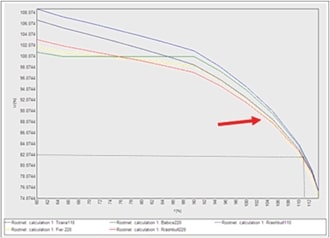
Picture 6. P-V curves of the weakest buses with 80 MVAr SVC installed in Babice220
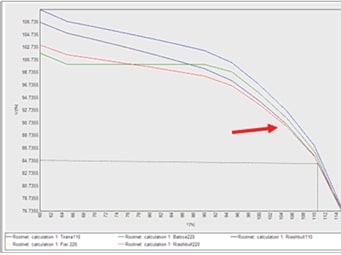
Picture 7. P-V curves of the weakest buses with 120 MVAr SVC installed in Fier220
Conclusion
Based on the gathered results in the previous section of this article, we draw the following conclusions:
- The method based in P-V curves and sensitivity coefficients is the adequate mechanism for defining the SVC FACTS devices optimal location;
- By using FACTS- SVC devices in the case of the Albanian Power System, we can see that the performance of the system has increased significantly.
