 One of our members kindly sent us an article in which he’s willing to explain how the energy is used in a fctory or in a building. Really interesting!
If you too want to send us essays or even debates, tutorials, career stories, testimonies from something you’ve experienced, simply send a mail to the team.
Introduction
Saving on electrical energy costs is the goal of every consumer, whether commercial or individual. This has many benefits such as letting companies reduce their production and operation costs and hence remain competitive. In addition, less energy usage means improved efficiency and less damage to the environment.
A well laid out assessment of the energy systems allows building managers to understand energy usages in various parts of the installation. This helps identify high energy usage areas and causes.
To understand how power is used, one must collect and analyzing as much data as possible. The data can help you pinpoint routine waste, inefficient equipment and practices that can either be replaced in case of equipment, or done differently.
The most effective way of collecting data usage is by checking consumption is by taking the meter reading at regular intervals. By checking against the activities going on at the high energy usage intervals, you will be able to identify the culprits.
Energy consumption profile
The best way to understand energy usage is by having an energy profile (demand profile) of the building or facility. The profile shows the rate at which energy is used over a given time by providing a detailed account of how the building or facility is using energy, including the time the energy used.
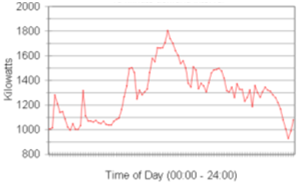
Figure 1: A 15 minute interval demand profile | image: http://www.energy.gov.za
A basic demand profile will have a series of manual meter readings recorded frequently. This can be at 15 or 30 minute intervals, hourly, daily or monthly. The interval is determined by what the data will be used for.
Generating an energy usage profile
There are different methods for generating the demand profile. These range from the cheapest and simplest manual meter reading to more complicated and detailed power meters that can record power usage, power factor, current, phase voltage and other power quality parameters.
Typical methods include:
- Reading the utility meter at regular intervals
- Power meters
- Clip-on Ammeter to measure load current at regular intervals
- Computer based Energy Management System
- Smart energy meters.
While the regular meter reading is the simplest and cheapest, it provides limited data. The smart metering system is the most expensive and complex to set up, however, it provides detailed information that includes energy usage as well as power quality.
Regardless of the method used to generate the demand profile, it should be done in a way that it captures the data during regular as well as peak demand times. This will assist in establishing what contributes to the most energy usage at any particular time.
Interpreting the demand profile
The detailed energy consumption data shows the patterns of energy usage over a certain period, something the monthly or weekly meter readings cannot show. The patterns make it easier to identify the energy wastage in the building.
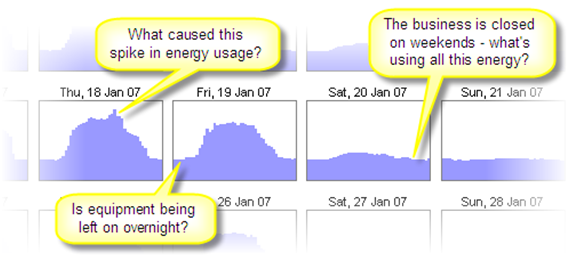
Figure 2: A daily energy usage plot | image: energylens
A regular check on the energy consumption data is important and will help the consumer notice if something has gone long. For example, a malfunctioning or misconfigured timer that lets the loads run when they are supposed to be switched off will increase the consumption but can be fixed if noticed in good time.
It might also give an indication of inefficient machines and justify replacing this with more efficient ones.
The energy profile helps consumers to understand how the consumption trends and how it is affected by external and internal factors.
What a consumer can establish from the profile:
- Peak Demand: The time, amount and duration of the peak demand periods
- Weather: effect due to demand for heating or cooling
- Night load: demand during unoccupied times and at night
- Effect of shut down and startup of machines, demand should clearly show consumption difference between time some loads are off and when they are on
- Duty cycle of the electrical loads
- Occupancy of the facility
- Increased production
Conclusion
The energy consumption data gives an insight into a facility or building’s energy usage. The demand graph, charts or map visualizes energy consumption and helps establish trends due to external and internal factors.
In addition, it helps identify how energy usage is influenced by factors such as the staff, people at home, controls, equipment efficiency and more. The map can then be used to implement a suitable energy plan that minimizes wastage and reduces the electricity costs.
Very nice! What did you think abotu this explaination? For those who hadn’t any idea of the subject, did you understand better? Give your feedbacks in the comments section.