
We received this article in our boxmail. It’s from a guest of the blog who wanted to contribute to the Electrical Engineering Community.
He chose to focus on Power Quality, and wrote a kind of “top 7” of the indices that play a role in measuring and quatifying disturbances.
Let’s check his writing:
Power quality disturbances can be categorized by various factors and methods. But, there a few indices that play a vital role in measuring the actual magnitude of the power quality disturbances.
Below mentioned are the seven most typical indices that play a major role in quantifying power quality disturbances:
- Displacement Index
- K Factor
- Total Power Index
- Recovery Time
- Notch Area
- Total Harmonic Distortion Index
- Crest Index
1. Displacement Index
When active power of the primary wave measured in watts, is divided by the actual power of the primary wave, the resultant is known as the displacement power factor. This is also the actual definition of the power factor.
2. K factor
When non-sinusoidal are applied to a particular transformer, the measurement of its ability to serve them is represented in the form of K factor. It can be calculated using the below formula:
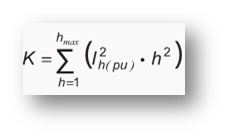
Where,
I-h is harmonic component that is multiplied by ‘h’ times the primary frequency
h is harmonic order of I-h
h-max is the maximum harmonic order
3. Total Power Index
When the total input power measured in Watts, is divided by the total volt-ampere (inclusive of the harmonic effects) input, total power can be calculated.
4. Recovery Time
The total time required for the output voltage to come back to the regulated value as per the specifications, after applying a step-up load or subsequent line charge, is known as recovery time.
5. Notch Area
The notch index in power quality disturbances can be illustrated as follows:
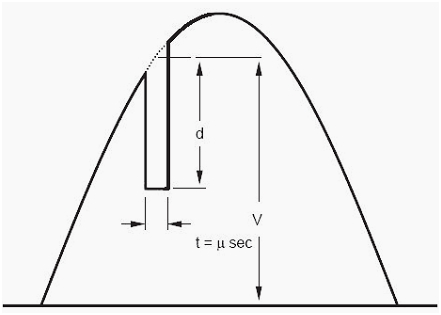
Above figure represents the notch area in a current system. I can be calculated using the below mentioned formula:
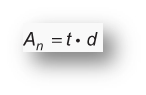
Where,
A-n is the notch area and is measured in volt-microseconds
t is the notch time measured in microseconds
d is the notch depth measured in volts
6. Total Harmonic Distortion Index
Total harmonics index or distortion factor, often represented as THD, is explained as the total magnitude of harmonic distortion present in a signal as measured. When the root square of all harmonic components is divided by the root square value of the frequency of the fundamental wave, total harmonic distortion factor is obtained.
It is given by the formula:
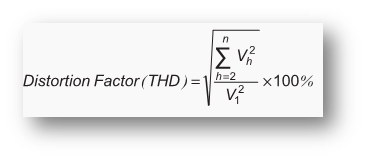
Where,
V-h is the root mean square (RMS) value of the current, defined at ‘n’ times of the fundamental frequency.
V-1 is the root mean square (RMS) value of the fundamental frequency of the current.
7. Crest Index
Crest Index or Crest Factor, can be defined as ratio of the maximum periodic function value to the RMS value of the periodic function.
It is defined by the formula:
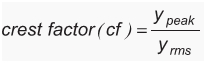
Where,
y-peak is the maximum value of the periodic function
y-rms is the RMS value of the periodic function
Conclusion
The above mentioned seven typical indices are very important and serve a great deal in assessing power quality disturbances. Measuring them effectively and accurately can help electrical engineers gauge the magnitude of the power quality disturbances faced by an electrical system.
Also, these measurements can prove to be very useful for an electrical engineer to take necessary steps directed towards controlling the power quality disturbances, and supply quality power to the end users.
Those were the 7 most typical indices of power quality disturbance. Do you have few ones to add?