We love Mile’s articles because they always relate his experiences as a student from Bitola in Romania. Here’s another essay from him about a new concept for power loss distribution in power networks without distributed generation, hope you’ll enjoy it!
If you want to send your work experiences for us to publish them in the blog, all you have to do is sending a mail to the team.

Introduction
Deregulation of the electrical energy market actualized the need of calculating and splitting the costs for covering the losses of distribution of electric power. Every consumer or electric power operator are included in the process of creating and covering the losses of power and energy. In the past few years, operators proposed some methods for calculating the losses of power in the network, which are caused by the companies that produce electric power and the consumers.
In this article, I have presented one of the newest methods for calculation of the distribution of the losses of electric power in radial distributive network. The method is based on the Load flow analysis of the radial network. I also used the “Sum current” method to calculate the voltages in the nodes, currents in the branches and the currents of the consumers in the network. While calculating the distribution of the losses, I used daily consumption diagrams.
On one sample network, with different types of consumers, I made calculations with the new ΔUCDELA (Voltage Drop Current Decomposition Energy Loss Allocation) method for power loss distribution and compared the results with two other known methods that are used for power loss distribution.
Calculating the daily power loss in power networks
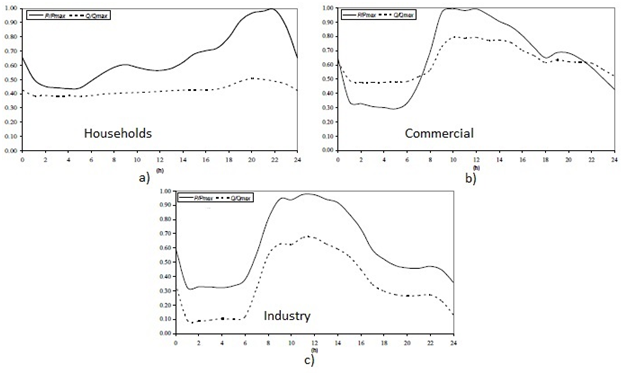
As I mentioned before, the daily diagrams for three types of consumers were given and they are presented in picture 1 in this section of the article. On these diagrams the change of active and reactive power is presented.
These diagrams are needed if we want to calculate the power loss allocation in the branches of the network and in the entire network, by using the ΔUCDELA (Voltage Drop Current Decomposition Energy Loss Allocation).The three given diagrams represent three types of consumers.
The first diagram represents Households, the second represents Commercial consumers and the last oen represents Industrial consumers. The power loss allocation is calculated every hour, having in mind that the values of the active and reactive power are not changing in that specific time.
By applying the ΔUCDPLA (Voltage Drop Current Decomposition Power Loss Allocation) method (on which the ΔUCDELA is based) and the power of consumers in the specified time, we can calculate the power loss allocation in the network.
Daily power loss in power networks (picture 1)
Because the load of the network does not change in the specified time (during one hour), the calculated power loss allocation in units kW, by value is equal to the power loss in kWh.
By applying the calculations 24 times (for every hour during the day), with the appropriate values for every specified hour from the daily diagram, as result we get the total power loss allocation of the daily power losses.
This is actually description of the algorithm for the ΔUCDELA method. In the following part I will describe the sample network and how the method was used.
Using ΔUCDELA on radial distributional network
Energy loss allocation for every consumer in the radial network without dispersed generation, is based on the sample network presented on picture 2.
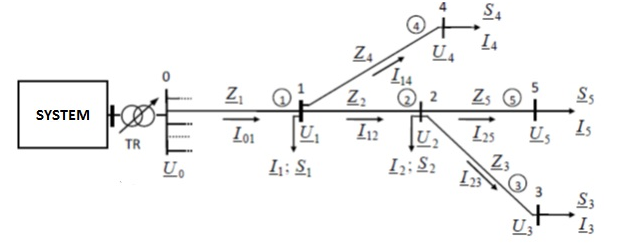
Sample radial network (picture 2)
The network has 5 branches, 6 nodes and 5 consumers. The characteristics on every part of the network are:
- Power lines are Al/Fe 35/6 mm2/mm2, with current Id =145 A , r = 0,8353 Ω/ km and x = 0,37 Ω/ km
- Lengths of the power lines are: l1 = 2,5 km; l2 = 6,0 km;l3 = 0,4 km; l4 = 0,5 km and l5 = 0,6 km
- The apparent powers of the consumers are: S1 = P1 + jQ1 = (400+ j130), S2 = P2 + jQ2 = (180+ j60), S3 = P3 + jQ3 = (140 + j40),
S4 = P4 + jQ4 = (200+ j70) and S5 = P5 + jQ5 = (100 + j30).
The voltage on the bus where the transformer is placed is kept at: U0 = (10,25 + j0)kV =10,25 kV∠0
The results from the calculations of the power loss allocation, with different methods are presented in table 1.
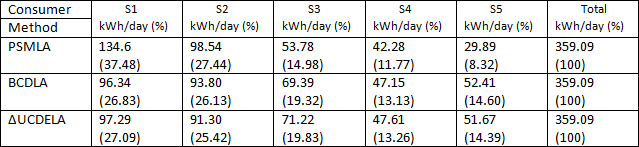
Results from calculations with different methods (table 1)
From the given results, we can draw a conclusion that with ΔUCDELA, as well as like the other two methods, the power loss allocation has the greatest level at nodes 1 and 2, which is logical because in these two nodes the biggest consumption is concentrated, as well as the fact that the power lines 1 and 2 have the biggest length in the system.
Conclusion
As we can see from the previous sections of the article, by applying this method for power loss allocation calculation, we can determine that this method has proven to be accurate, reliable and robust method for these calculations. I suppose that we will all agree that this method can be also used in cases where we have dispersed generation in the network.
Mile.
Very interesting isn’t it? Thanks Mile for sharing. What do you all think about his essay?